May 4, 2026
Fed holds again, housing starts surge, and HUD clears the air for buyers.
May 1 is one of the most popular moving days in the U.S. Leases turn over, school years wind down, and for-sale signs start popping up across the country. It marks the heart of peak home buying season, and this year buyers and sellers are stepping into a market full of mixed signals. In this edition of Rocket Fuel we look at new residential construction starts, the Fed holding rates, HUD’s letter to REALTORS®, and a deep dive into the effect of oil prices on mortgage rates.
Fuel up! 🚀


Bizz Buzz
Starts sp, permits Down
New residential construction starts surged 10.8% in March to an annualized 1.5 million units, the strongest pace since December 2024 with single-family starts climbing 9.7% and gains recorded across all four regions. But the forward-looking signal cut the other way: building permits fell 10.8% to 1.372 million, their lowest level since August 2025. Builders are breaking ground now but pulling back on future commitments a split that suggests today's momentum has a short shelf life.
The Fed holds, again
The Fed voted to hold rates steady at its April meeting, extending a pause that's been in place since December 2025. The decision wasn't clean, four officials dissented, with one pushing for a cut and three others opposing even the statement's easing bias. Policymakers pointed to the U.S.-Iran conflict as a driver of oil-fueled inflation pressure, keeping the committee cautious. With no May meeting on the calendar, mortgage markets will take their cues from inflation data and geopolitical developments instead.
HUD clears agents to share crime and school data
HUD's "Dear Colleague" letter issued April 24 clarifies that sharing neighborhood crime rates and school quality data with prospective buyers does not violate the Fair Housing Act as long as it's done consistently and without discriminatory intent. The move reverses years of industry suppression where many listing platforms had pulled the data following a 2021 directive, and NAR had instructed agents to avoid directly answering client questions on the topic. HUD called it a transparency failure, not fair housing protection. Platforms are now reviewing when the data comes back.
Caffeinated Trends
Do oil prices move mortgage rates?
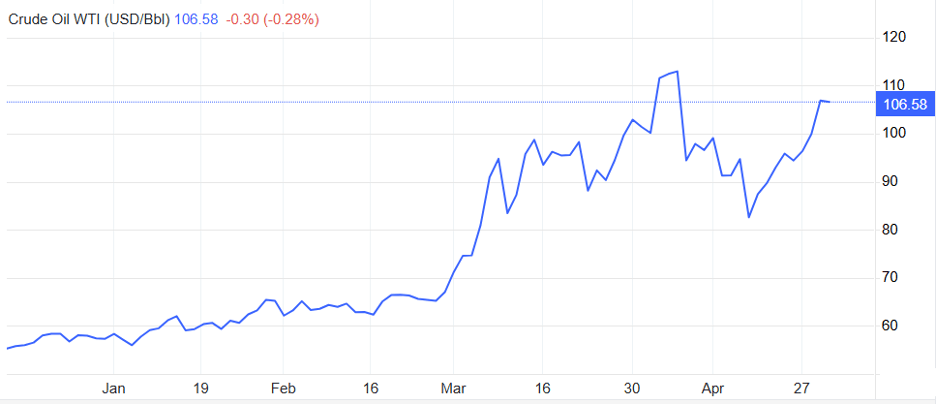
Oil prices have been pushing mortgage rates higher, and many might not realize it.
Beginning in March, oil prices have risen sharply, driven by geopolitical tensions and supply disruptions. Since the start of the year, the price of crude oil is up by over 80%.

At the same time, the 10-year Treasury yield, a benchmark for mortgage rates, has also moved higher.

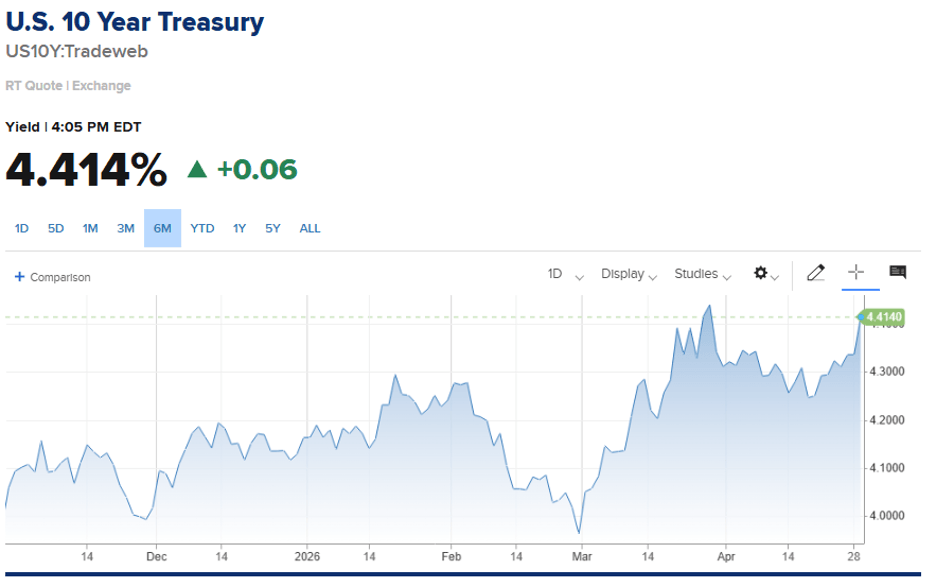
This is not a coincidence.
The connection is inflation and inflation expectation. While the price of oil itself is only a small component when measuring inflation, it is an input cost to almost everything else.
An increase in oil prices raises manufacturing and transportation costs. As businesses face higher input and delivery expenses, those costs are often passed on to consumers in the form of higher prices.
As inflation expectations rise, investors demand higher yields, pushing up the 10-year Treasury and, in turn, mortgage rates.
While future inflation reports face upward pressure, the magnitude remains uncertain.
At this week’s FOMC meeting, Chairman Powell noted that “near-term measures of inflation expectations have risen this year, likely reflecting the substantial increase in oil prices.” He also emphasized that the Fed is well positioned to wait and assess how these pressures impact longer-term inflation.
Markets are now pricing in zero rate cuts for the remainder of 2026, signaling a return to the “wait and see” environment that we’ve become familiar with.
This week’s puzzle gets 2 Rockets out of 5.
2 Rockets
This article is for informational purposes only, and is not a substitute for professional advice from a medical provider, licensed attorney, financial advisor, or tax professional. Consumers should independently verify any service mentioned will meet their needs.