January 5, 2026
Interest rate projections: What brokers need to know.
Can you move an entire city?
Sweden’s northernmost city, Kiruna, home to roughly 23,000 people, is doing just that. Built on an iron-ore mine, the city is relocating residents and buildings nearly 2 miles east, one by one, to make room for the mine’s expansion.
Fuel up! 🚀


Bizz Buzz
Pending home sales climb across the U.S.
Pending home sales increased 3.3% in November compared to October and 2.6% year-over-year. This marks the highest level in nearly three years, according to the National Association of REALTORs. All four U.S. regions saw a rise in activity, led by the West, where pending sales jumped nearly 10% month-over-month.
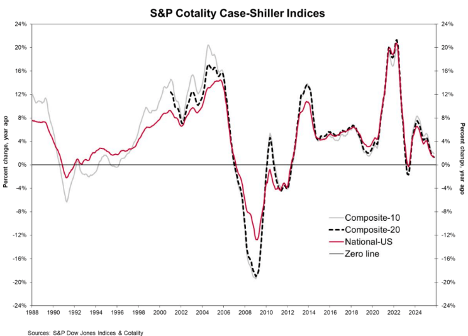
Home price growth slows
The S&P Case-Shiller Home Price Index reported a 1.4% annual increase in home prices for October 2025, up slightly from 1.3% in September. This is a modest year-over-year gain and is one of the weakest readings in recent years. Among the 20 markets tracked, eight posted year-over-year price declines.

Caffeinated Trends
Every time the calendar flips to a new year, banks, and financial research firms mark the occasion by publishing their outlook for what’s ahead.
Many predictions highlight stock picks and industries expected to perform well under current economic conditions. In the mortgage market, however, the focus is often on projections for interest rates.
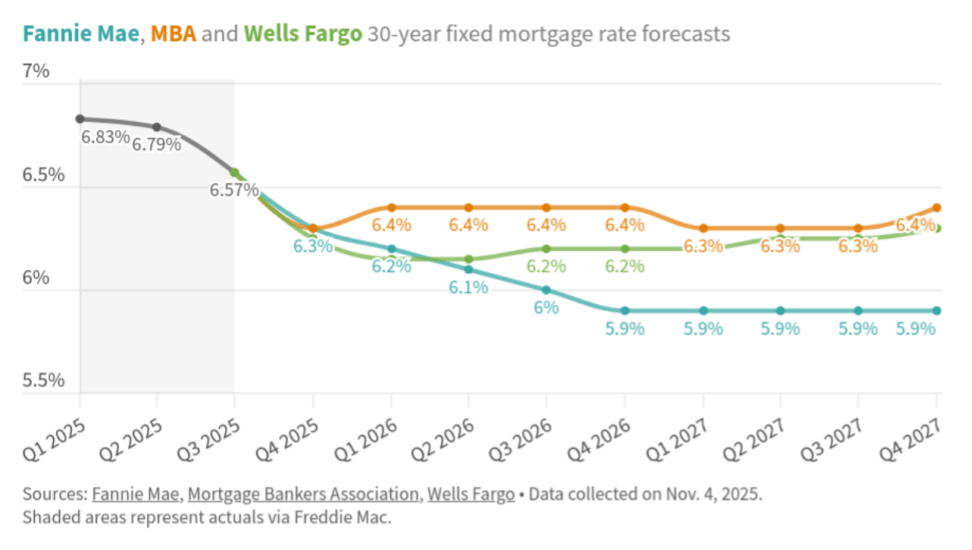
The chart below shows where three industry firms expect rates to trend over the next 12 to 24 months.

Why projections are only part of the story
On many mortgage trading desks, it’s become a running joke that these projections are more window dressing and pontification than reliable roadmaps for where rates are headed.
If you’ve tracked interest rates over time, you’ll notice how heavily they depend on current conditions and how quickly they can react to economic shocks such as COVID or persistent inflation that was expected to be transitory.
While it’s useful to look ahead, keep in mind that rates are highly data dependent as the Fed digests information and determines its path forward, so projections can change fast.
Sometimes the best shortcut is to go straight to the source. Check out the Fed Dot Plot, where the FOMC voters (the ones who actually set rates) show where they think rates are headed.

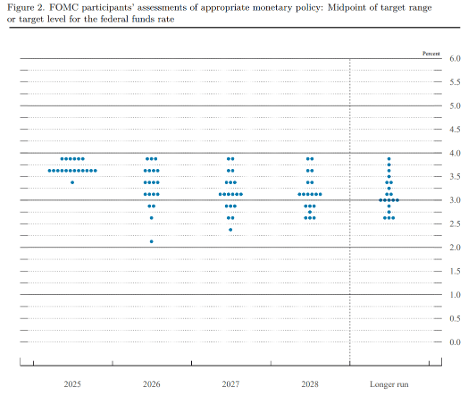
What the Fed Dot Plot can tell us
While the Federal Funds Rate is not the same as the interest rate borrowers pay on their mortgage, it’s a big driving factor.
The most recent Dot Plot from December shows more agreement among FOMC voters for 2025, likely because the year was nearly over. Looking ahead to 2026 and 2027, there is a wider range of opinions, while projections for 2028 and the “longer run” show more alignment among participants.
This affirms that while we know where we are today, and generally where things could go longer term given the current state of affairs, the next couple of years bring uncertainty that spreads out those opinions.
Overall, most participants expect rates to ease somewhat over the next few years, but concerns about inflation persist, as it remains above the long-cited 2% target, even though the Fed switched its framework to an average of 2% over time.
Only time will tell.
This week’s puzzle gets 3 Rockets out of 5.
3 Rockets